Top 10 Filling Machine Manufacturers in the World
The global filling machine industry is becoming more precise, connected, and demanding. Food, beverage, pharmaceutical, cosmetic, and chemical producers now require stable dosing, shorter changeovers, and cleaner production zones. A small filling error can waste thousands of containers. It can also damage consumer trust.
Recent reports support this shift. PMMI’s 2024 State of the Industry research identifies automation, labor shortages, digital monitoring, and flexible packaging formats as major machinery priorities. Grand View Research also reports continued expansion in the global packaging machinery market, supported by processed food, bottled beverages, and pharmaceutical production. However, market estimates differ between research firms. Their definitions are not always identical. That limitation deserves attention.
Jim Pittas, president and CEO of PMMI, has stated, “Automation should augment people, not simply replace them.” This principle matters when evaluating every filling machine manufacturer. The strongest suppliers do more than sell equipment. They provide hygienic design, accurate volumetric or weight-based filling, remote diagnostics, operator training, and dependable after-sales service. Some companies lead in high-speed beverage lines. Others perform better with viscous products, sterile filling, or small-batch production.
This Top 10 list compares global manufacturers through practical criteria. These include engineering capability, filling accuracy, line integration, validation support, sustainability, and customer experience. It is not a perfect ranking. Regional service quality can change the result. A technically impressive machine may still disappoint without suitable maintenance support. Buyers should therefore test product compatibility, container handling, cleaning procedures, and total ownership costs before making a final decision.
Global Filling Machine Market: 2024 Value and Forecast CAGR Through 2030
Top 10 Filling Machine Manufacturers in the World
The global filling machine market is estimated at approximately USD 7 billion in 2024. Forecasts commonly place its CAGR between 5% and 7% through 2030. However, market values differ by product scope, region, and equipment type. Some reports include integrated packaging lines, while others count filling units only.
The leading ten manufacturers are typically evaluated through measurable capabilities. These include dosing accuracy, line speed, hygienic design, changeover time, and after-sales support. In beverage plants, modern systems may fill thousands of containers hourly with limited product loss. Pharmaceutical facilities demand tighter control, documented validation, and cleanroom compatibility. Food processors often prioritize washdown access and reliable operation under frequent temperature changes.
Demand is growing across Asia-Pacific, North America, and Europe. Smaller producers are also investing in modular machines because they need flexible production without excessive floor space. Energy use matters more than it did five years ago. Servo-driven systems can reduce waste, but the purchase price may remain difficult for smaller factories. That trade-off deserves closer review. Forecasts also assume steady industrial investment, yet supply disruptions and changing material costs could weaken growth before 2030. Buyers should compare total ownership costs, not only the quoted machine price. Factory trials, sample testing, and service response records provide stronger evidence than impressive brochures.
Filling Machine Fundamentals: Accuracy, Capacity, and Speeds Above 30,000 BPH
Filling Machine Fundamentals: Accuracy, Capacity, and Speeds Above 30,000 BPH
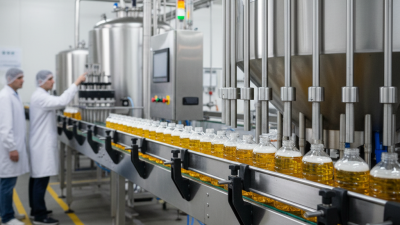
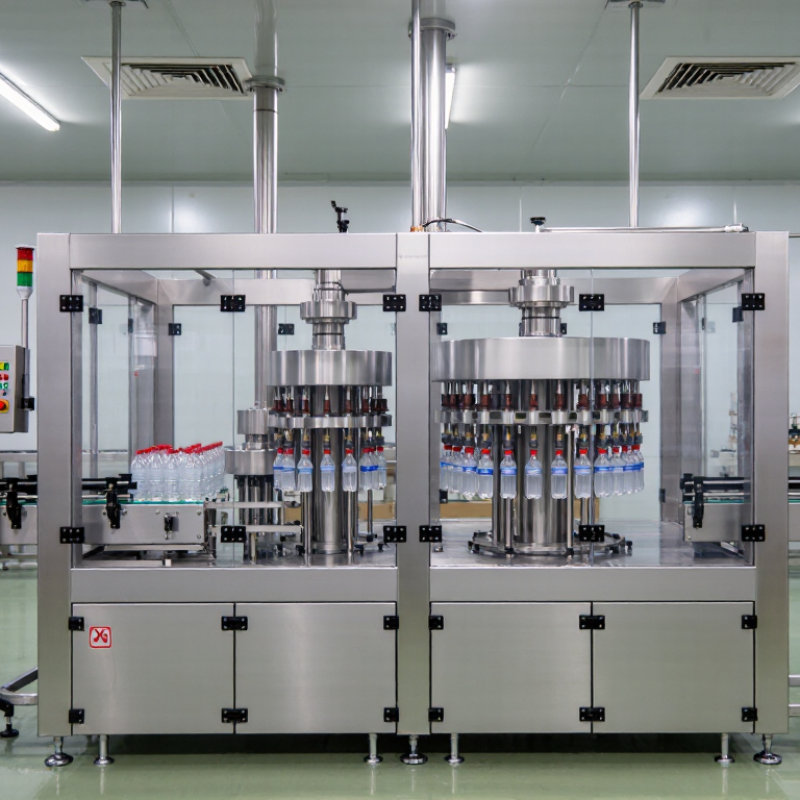
A filling line producing above 30,000 bottles per hour moves nearly 500 bottles each minute. Speed alone does not prove performance. Accurate filling depends on product viscosity, temperature, foam, and container shape. A thin liquid may require different valve timing than a thick concentrate. Even small pressure changes can affect every bottle. Experienced engineers verify accuracy with repeated weight checks, not one impressive test.
Real capacity is usually lower than the nameplate figure. Operators must account for star-wheel transfers, capper timing, bottle changes, cleaning, and brief stoppages. In plant trials, a line rated at 36,000 BPH may deliver less during long production runs. That difference matters. Reliable systems use stable pumps, responsive sensors, reject tracking, and accessible adjustment points. Faster machines also need careful synchronization, because one misaligned bottle can interrupt the entire stream. I still question any specification that lacks product details and test conditions.
Tips: Request results from a product sample, not water alone. Confirm accuracy at startup and near the end of a run. Review actual bottles per hour, changeover time, and rejected containers. Leave capacity headroom. Running at maximum speed every day may reduce stability. Water tests look clean, but real products often behave differently.
Top 10 Global Manufacturers: Technologies, Markets, and Production Capacities
Top 10 Filling Machine Manufacturers in the World
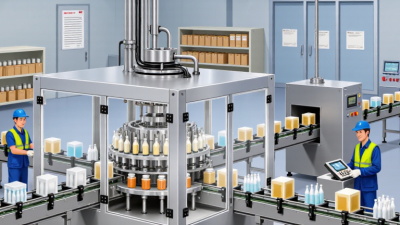
The top ten global manufacturers compete through technology, market reach, and production capacity. Their portfolios usually cover liquid, powder, viscous, and particulate products. A modern facility may combine piston fillers, rotary systems, servo drives, and robotic case packing. Operators can adjust fill volumes through digital interfaces, while sensors detect missing containers or unstable flow.
Production capacity means more than factory size. Some manufacturers produce hundreds of machines yearly, while others focus on customized lines with slower output. Line speeds can range from 30 containers per minute to more than 1,000, depending on product behavior and container design. Capacity is contextual. A thick cream needs different equipment from a low-viscosity beverage. This distinction is often overlooked.
Global markets also shape engineering choices. Food producers may prioritize cleanable frames and rapid changeovers. Pharmaceutical facilities require traceability, controlled environments, and validated filling accuracy. Personal-care manufacturers often need flexible systems for many bottle shapes. Service coverage matters as much as machine speed, especially when spare parts cross borders. Reliable suppliers provide testing, installation support, operator training, and documented maintenance procedures.
Comparing the ten leaders requires careful evidence. Useful indicators include certified quality systems, installed equipment, response times, factory output, and customer references. Marketing claims can sound impressive. They are not always comparable. Published capacities may describe theoretical output rather than tested production. A factory trial using the customer’s actual product offers stronger evidence. Even then, results can change with temperature, viscosity, container tolerances, and operator experience.
Top 10 Filling Machine Manufacturers in the World
Global Technologies, Markets, and Production Capacities
The chart compares representative maximum rated speeds commonly published for major industrial filling technologies. Rotary volumetric, aseptic, and overflow systems generally support higher production capacities, while piston and peristaltic systems are selected for accuracy and flexible product handling.
Capacity is expressed in containers per minute and varies according to container size, product viscosity, filling volume, machine configuration, and line layout.
Manufacturer Comparison: Fill Accuracy, OEE, Automation, Service, and Cost
Top 10 Filling Machine Manufacturers in the World
Comparing filling machine manufacturers requires more than checking advertised speed. Fill accuracy affects giveaway, rework, and customer confidence. During factory trials, measure average deviation, standard deviation, and changeover waste using the actual product. OEE matters too. A widely used benchmark from Vorne places world-class OEE at 85%, while many plants remain close to 60%. This gap can outweigh a machine’s impressive brochure speed.
Automation should reduce operator decisions, not simply add screens. Deloitte’s 2023 Smart Manufacturing Survey found that 86% of manufacturing leaders expect smart manufacturing to become a major competitiveness driver within three years. Look for recipe control, automatic reject tracking, remote diagnostics, and clear data ownership. Service deserves equal attention. Ask for response times, spare-parts availability, technician coverage, and documented training. Cost comparisons should include installation, validation, utilities, maintenance, product loss, and downtime. A cheaper machine may become expensive after one difficult format change. The spreadsheet can still be wrong.
Tips: Request a live test with your containers, closures, viscosity, and target fill volume. Record ten changeovers, not one. Compare OEE using the same formula across suppliers. No scorecard is perfect. Leave space for operator feedback, because practical usability is often missed. Insist on written accuracy limits and service commitments. Industry surveys support automation, but your line conditions decide whether it pays.